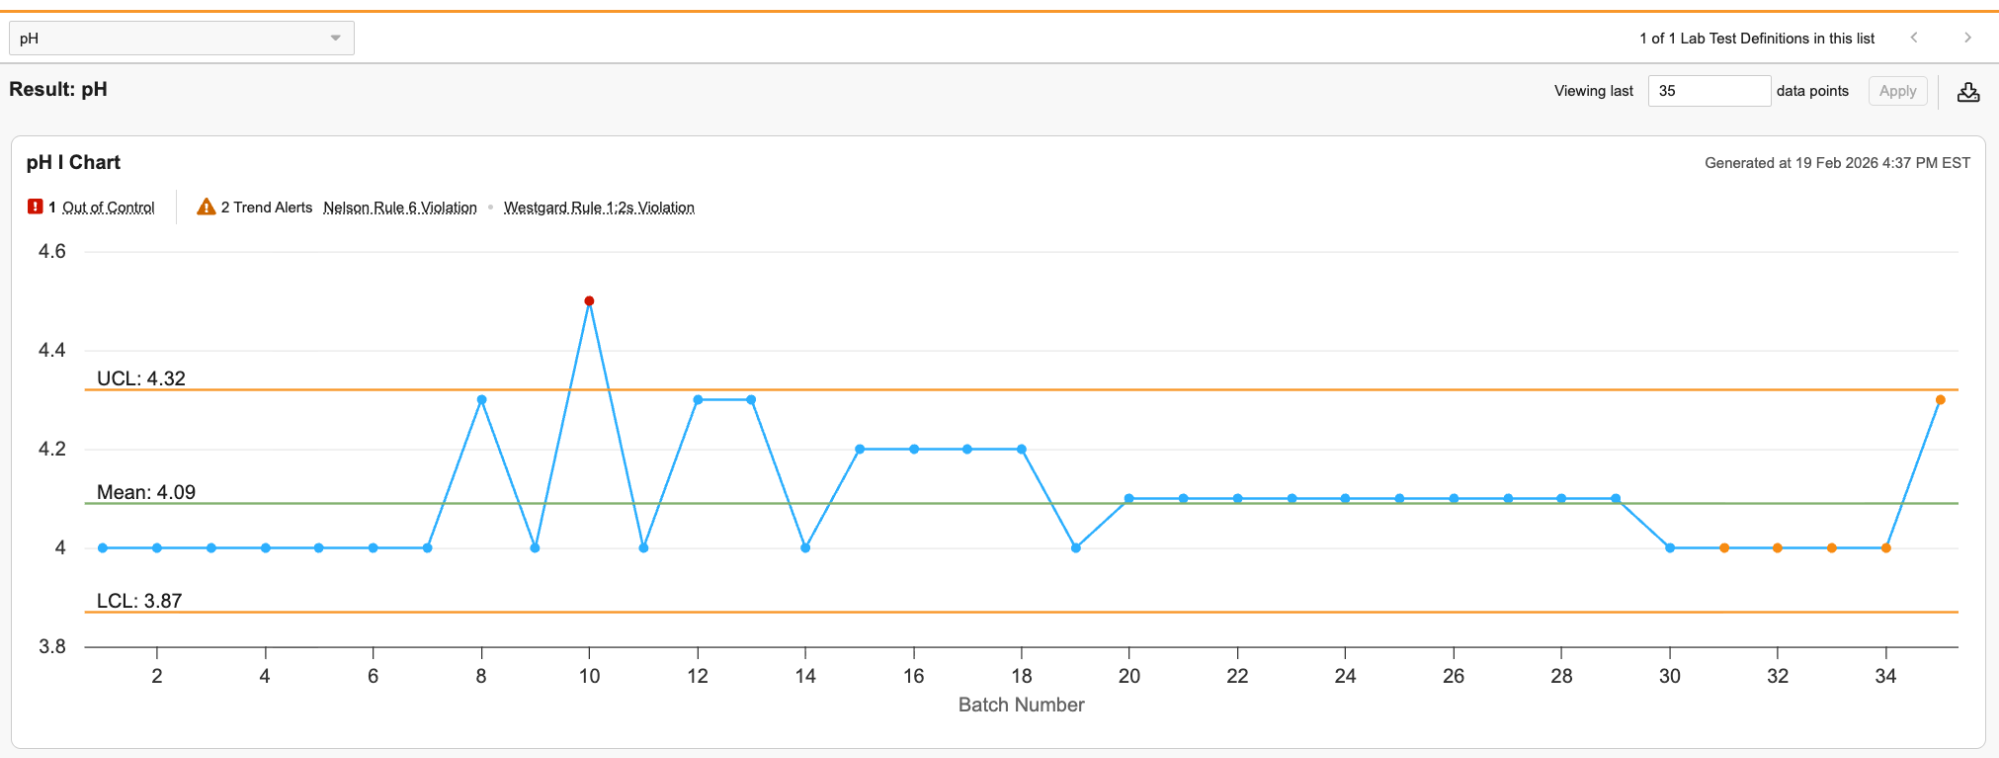
 On this page, you can view each chart with a summary of its OOC data points and trend alerts on the top. The trend alerts inform you of any violations of Nelson Rules or Westgard Rules. A dropdown menu in the upper left allows you to navigate between *Tests*. If a *Test* has multiple *Results*, there is a subtab for each *Result* below the dropdown. You can change the number of data points displayed, up to a maximum of 100, using the field in the upper right.
The title of each chart includes the chart type and the *Test* it tracks. The X-axis is the *Batch* in order of *Manufactured Date* and the Y-axis is the *Result* data points. If a *Batch* does not have a *Manufactured Date* set, it is not included in the chart. You can hover over each data point to view any alerts for that data point as well as a link to its *Spec Execution*. In addition to the data points, there are lines for the Upper Control Limit (UCL), Mean, and Lower Control Limit (LCL). The value for each of these lines is displayed to a precision of one more decimal place than the *Result Definition* used in the *Spec Execution*.
On this page, you can view each chart with a summary of its OOC data points and trend alerts on the top. The trend alerts inform you of any violations of Nelson Rules or Westgard Rules. A dropdown menu in the upper left allows you to navigate between *Tests*. If a *Test* has multiple *Results*, there is a subtab for each *Result* below the dropdown. You can change the number of data points displayed, up to a maximum of 100, using the field in the upper right.
The title of each chart includes the chart type and the *Test* it tracks. The X-axis is the *Batch* in order of *Manufactured Date* and the Y-axis is the *Result* data points. If a *Batch* does not have a *Manufactured Date* set, it is not included in the chart. You can hover over each data point to view any alerts for that data point as well as a link to its *Spec Execution*. In addition to the data points, there are lines for the Upper Control Limit (UCL), Mean, and Lower Control Limit (LCL). The value for each of these lines is displayed to a precision of one more decimal place than the *Result Definition* used in the *Spec Execution*.
Note: If the Result for the Spec Execution is not complete, the chart displays the text “No chart data available yet.” in place of data points.
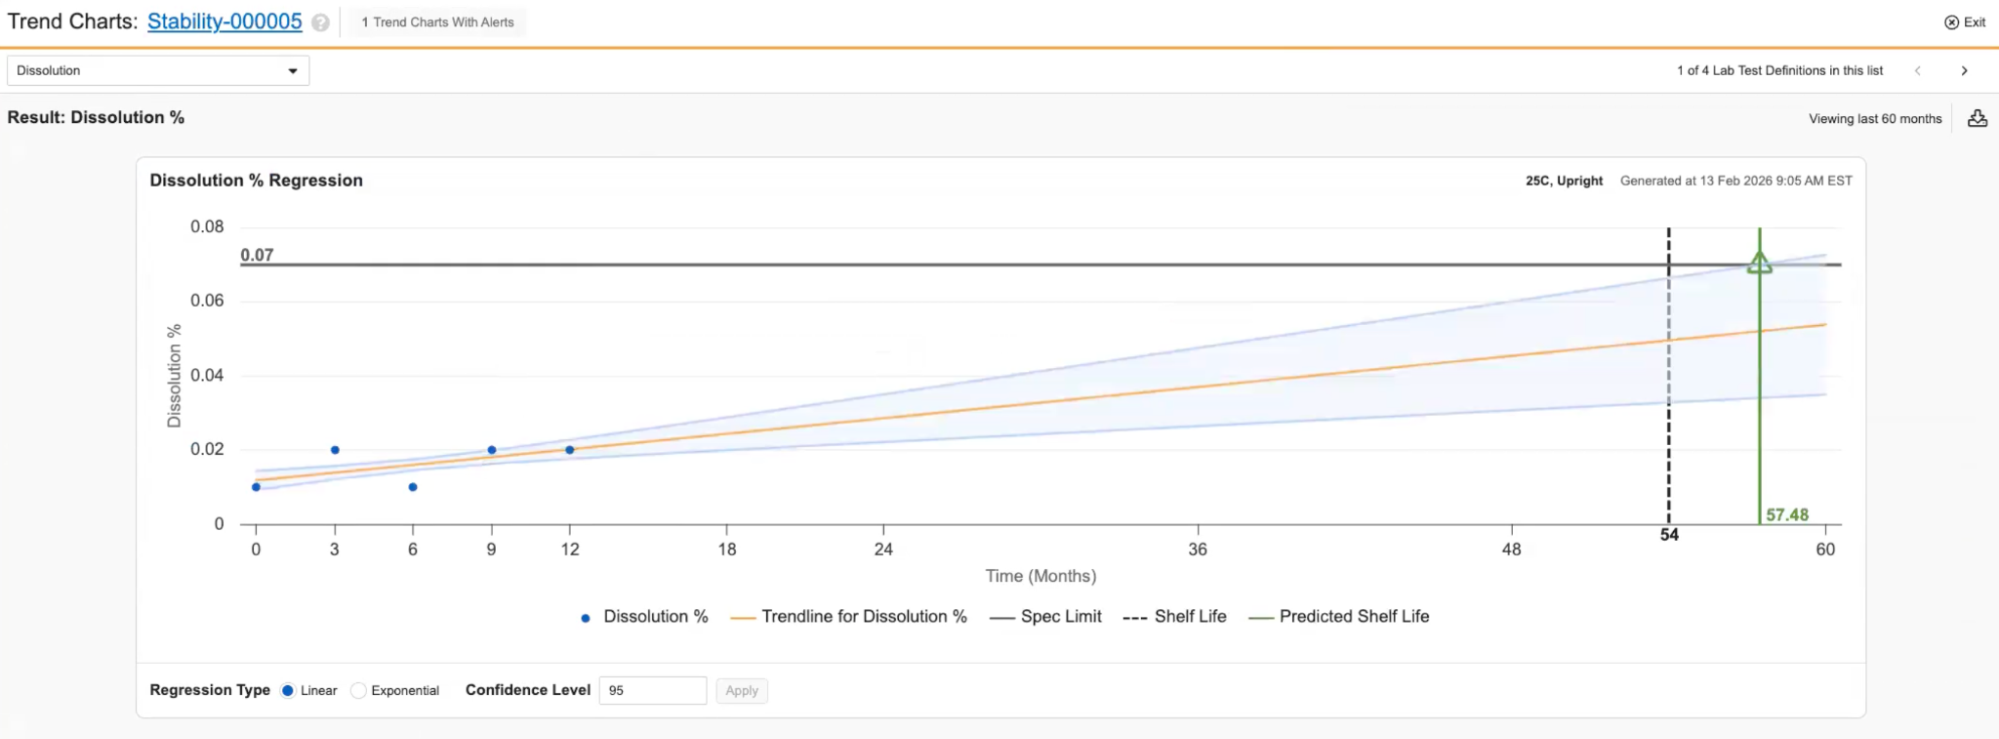 When viewing the *Trend Charts* page for Stability Study Regression Charts, the layout is similar, but the information displayed is slightly different. The X-axis displays the study's *Timepoints* in chronological order (including both completed and future *Timepoints*) and the Y-axis is the *Result* data points. The chart displays the *Material*'s shelf life as a vertical dotted line and predicted shelf life as a solid vertical line. This line is green if it is after the shelf life and red if it is before. If the *Material* did not have a shelf life set at the time the study was initiated, there is no indicator comparing it to the predicted shelf life and the predicted shelf life is represented as a solid black vertical line. You can change the *Regression Type* and *Confidence Level* in the bottom.
To download the analysis, click the **Download** button in the top right. This downloads an excel file containing a sheet for each chart that includes an image of the chart along with information about the chart, such as its data points.
When viewing the *Trend Charts* page for Stability Study Regression Charts, the layout is similar, but the information displayed is slightly different. The X-axis displays the study's *Timepoints* in chronological order (including both completed and future *Timepoints*) and the Y-axis is the *Result* data points. The chart displays the *Material*'s shelf life as a vertical dotted line and predicted shelf life as a solid vertical line. This line is green if it is after the shelf life and red if it is before. If the *Material* did not have a shelf life set at the time the study was initiated, there is no indicator comparing it to the predicted shelf life and the predicted shelf life is represented as a solid black vertical line. You can change the *Regression Type* and *Confidence Level* in the bottom.
To download the analysis, click the **Download** button in the top right. This downloads an excel file containing a sheet for each chart that includes an image of the chart along with information about the chart, such as its data points.
Note: For non-numeric entries (for example, ND) when LOD/LOQ is configured, the system uses the value defined for calculations (for example, 0, the limit value, or half the limit) to ensure the point can be plotted.
Note: If you select Exponential regression but the data contains 0 or negative numbers, the system displays an error message.